Explore Our
“Off The Wall” Blog
Unique, straight-forward, unfiltered opinion on topics of concern for individuals with newfound wealth.
She Just Got Her 2013 Year-End Statement

Emma Thompson knows how to party! This is a picture of her at the Golden Globes last weekend and it cracked me up. Finally there was something other than the teleprompter slog that had me more interested in a 3-month-old copy of Handyman Magazine than the awards show. It’s also possible that she just got her 2013 statements and decided to party despite the Dow being down -0.80% so far this year. Rewind a year ago and the Dow was up +4.0% on news that we averted the Fiscal Cliff. Things are so BORING now with no crisis and all this capital gains selling from a rocking 2013…
Hours and hours (and millions of advertising dollars) have been spent on CNBC over the past week sounding off on why the market has sold off. Remember, the past two years were unique in that the S&P 500 never saw a day where the YTD return number was negative for the year. Two straight years. That’s pretty incredible. Now the S&P 500 index has failed to have a single trading day close above the 2013 closing index level.
Time to panic?
If you said yes, get a grip. Here’s why the market has sold off:
- Investors are catching their breath.
- Portfolios are being rebalanced. Institutions and investors who rebalance annually have some equities to sell… a +30% run in equities will do that to ya!
- Investors may be locking in profits.
- Investors may be selling now to delay the tax bill for 16 months. (Tax on gains taken now is not due until April of 2015.)
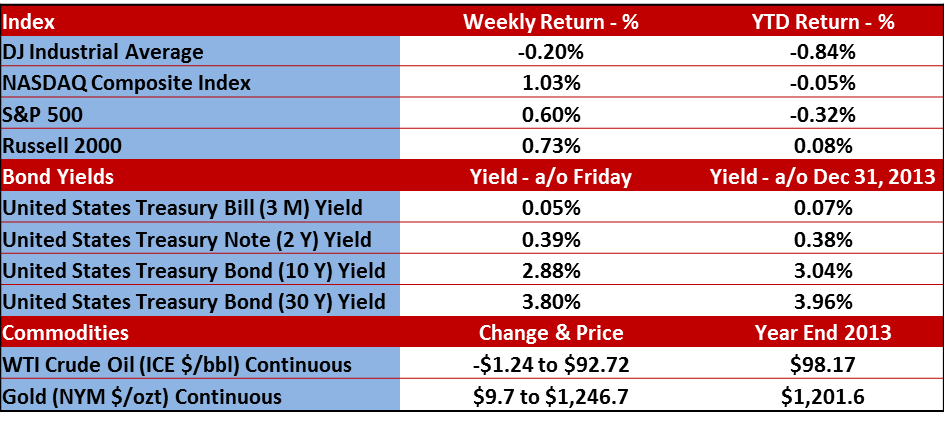
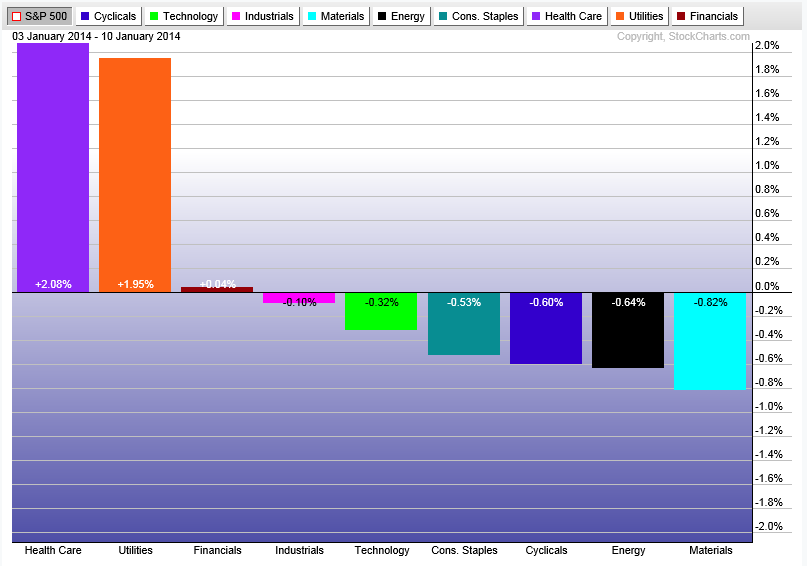
Below are our two standard charts that review the previous week’s performance across the major benchmarks and for the ten sectors of the S&P 500 index.
The chart below shows how well each sector did vs. the S&P 500 (rather than its actual total return). Of note is that Utilities outperformed the S&P 500 by almost 2% points. Utilities were the worst performing sector in the S&P 500 in 2013 and they are a very defensive sector. Looks like either some rebalancing (see numbered list above) or knee jerk reaction to a poor start in the equity markets this year.
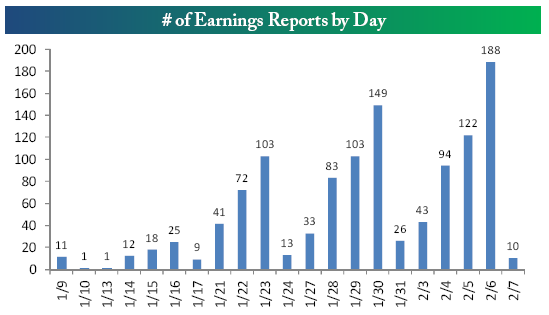
Earnings Season
I’m convinced my life is flying by because of quarterly earnings reports. It seems like every time I look up it’s a new quarter. When I was a kid, I had one data point in a year – summer vacation. Now I have four per year. I’m convinced that this contributes to life flying by. I’m going to blame mid-40’s weight gain on this too while I’m at it.
But it’s here…
Here is a chart from Bespoke Investment Group that shows the heavy reporting coming up this month. As you can see, there will be a lot to write about the week of Jan 24th.
Economics
We’ve seen a few important economic releases this year:
- The Unemployment Rate dropped to 6.7%
- ISM Manufacturing came in with a reading of 57 vs. the expected 56.8. A number above 50 signifies expansion in manufacturing. This is a good reading
- ISM Non-Manufacturing (AKA ISM Services) printed a reading of 53 vs. an expected reading of 54.5.
- Non-Farm Payrolls came in showing 74,000 new jobs added last month vs. an expected 200,000 new jobs. So that kind of sucked.
The employment components embedded in both ISM readings improved month to month. That’s good for the overall employment outlook even though the march towards regaining the prior peak in employment during this recession has been VERY LONG relative to past recessions.
Please call or email with questions.
Investment advice offered through Monument Advisory Group, LLC a Registered Investment Advisor (RIA).
The opinions voiced in this material are for general information only and are not intended to provide specific advice or recommendations for any individual. To determine which investment(s) may be appropriate for you, consult your financial advisor prior to investing. All performance referenced is historical and is no guarantee of future results. All indices are unmanaged and cannot be invested into directly. Stock investing involves risk including loss of principal. The Dow Jones Industrial Average is comprised of 30 stocks that are major factors in their industries, and widely held by individuals and institutional investors. The Standard & Poor’s 500 Stock Index (S&P 500) is an unmanaged capitalization weighted index of 500 stocks designed to measure performance of the broad domestic economy through changes in the aggregate market value of 500 stocks representing all major industries. The NASDAQ Composite Index measures all domestic and non-U.S. based common stocks listed on The NASDAQ Stock Market. The market value, the last sale price multiplied by total shares outstanding, is calculated throughout the trading day, and is related to the total value of the Index. The Russell 2000 Small Stock Index is an unmanaged index generally representative of the 2000 smallest companies in the Russell 3000 Index. The Russell 2000 is an unmanaged index generally comprised of companies with lower price-to-book ratios and lower forecasted growth values. The 2, 10 and 30 year Treasury is simply the yield at the close of the day.
(1) West Texas Intermediate crude spot price is as of end of week.
(2) London Bullion Market Association; gold fixing pricing at 3 p.m. London time.

David B. Armstrong, CFA
President & Co-Founder
Dave got into the industry when he discovered his passion for finance in his mid-20’s. He’s a combat veteran and served as an officer in the United States Marines Corps on both active duty and in the reserves, retiring at the rank of Lieutenant Colonel. While serving on active duty, Dave was unable to spend money on deployments, so he became a self-taught investor. Along with a few bucks cash as a bouncer, his investing performance grew to be good....
IMPORTANT DISCLOSURE INFORMATION
Please remember that past performance is no guarantee of future results. Different types of investments involve varying degrees of risk, and there can be no assurance that the future performance of any specific investment, investment strategy, or product (including the investments and/or investment strategies recommended or undertaken by Monument Capital Management, LLC [“Monument”]), or any non-investment related content, made reference to directly or indirectly in this blog will be profitable, equal any corresponding indicated historical performance level(s), be suitable for your portfolio or individual situation, or prove successful. Due to various factors, including changing market conditions and/or applicable laws, the content may no longer be reflective of current opinions or positions. Moreover, you should not assume that any discussion or information contained in this blog serves as the receipt of, or as a substitute for, personalized investment advice from Monument. To the extent that a reader has any questions regarding the applicability of any specific issue discussed above to his/her individual situation, he/she is encouraged to consult with the professional advisor of his/her choosing. No amount of prior experience or success should be construed that a certain level of results or satisfaction will be achieved if Monument is engaged, or continues to be engaged, to provide investment advisory services. Monument is neither a law firm nor a certified public accounting firm and no portion of the blog content should be construed as legal or accounting advice.
A copy of the Monument’s current written disclosure Brochure discussing our advisory services and fees is available for review upon request or at www.monumentwealthmanagement.com/disclosures. Please Note: Monument does not make any representations or warranties as to the accuracy, timeliness, suitability, completeness, or relevance of any information prepared by any unaffiliated third party, whether linked to Monument’s website or blog or incorporated herein, and takes no responsibility for any such content. All such information is provided solely for convenience purposes only and all users thereof should be guided accordingly.
Historical performance results for investment indices, benchmarks, and/or categories have been provided for general informational/comparison purposes only, and generally do not reflect the deduction of transaction and/or custodial charges, the deduction of an investment management fee, nor the impact of taxes, the incurrence of which would have the effect of decreasing historical performance results. It should not be assumed that your Monument account holdings correspond directly to any comparative indices or categories. Please Also Note: (1) performance results do not reflect the impact of taxes; (2) comparative benchmarks/indices may be more or less volatile than your Monument accounts; and, (3) a description of each comparative benchmark/index is available upon request.
Please Remember: If you are a Monument client, please contact Monument, in writing, if there are any changes in your personal/financial situation or investment objectives for the purpose of reviewing/evaluating/revising our previous recommendations and/or services, or if you would like to impose, add, or to modify any reasonable restrictions to our investment advisory services. Unless, and until, you notify us, in writing, to the contrary, we shall continue to provide services as we do currently. Please Also Remember to advise us if you have not been receiving account statements (at least quarterly) from the account custodian.