Explore Our
“Off The Wall” Blog
Unique, straight-forward, unfiltered opinion on topics of concern for individuals with newfound wealth.
Just Because the Calendar Flipped It Does Not Mean You Should Too

Last week was the worst week since the summer of 2012 for the S&P 500 index. It was down -2.6%. The DJIA was off even more, shedding -3.5%. So what gives? With almost a 30% run in the S&P 500 for the 2013 calendar year, is it a big deal that it has moved 3% off its all-time high? Are the bears awakening?
There are a few reasons why we had such a poor week. One has to do with some weak readings coming out of China that have some economists worried that their manufacturing sector may pull back a bit. A pull back in China could possibly cause other slowdowns around the world. However, keep in mind that one reading does not indicate a trend. In fact, see this chart below.
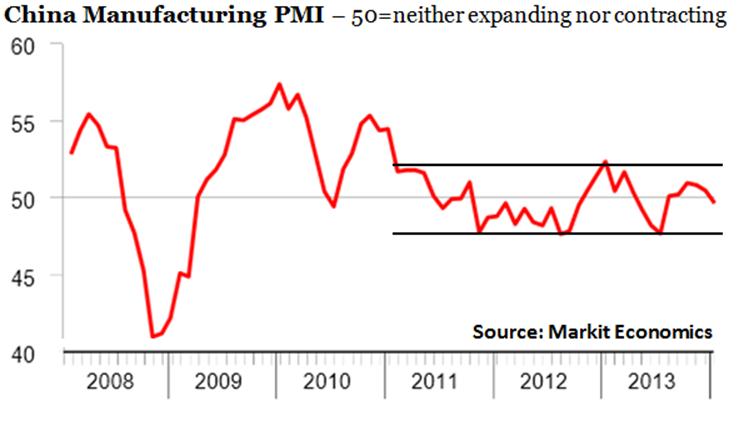
Is China’s manufacturing worth watching? Sure. Is it worth losing sleep over? No.
Investors also seem to be worrying that the effects of the taper taking place in the U.S. are starting to kick in. As a result, emerging markets, which have benefited in the past from strong Chinese growth, reacted negatively to the above.
Since emerging market economies have been the beneficiaries of the easy money that the U.S. Fed pumps out, worries about the taper have weighed on those developing/emerging market economies. (Remember, developing and emerging markets are the same thing… some people just interchange them to sound smarter-er). Throw in some of the general political instabilities that flash up now and again – oh, like a little bit of political scandal in Turkey that blows a hole in their stock market and crushes their currency – alongside a continued downtrend in commodity prices, and emerging markets take a hammering. So here at home, with U.S. stocks near their record highs and sentiment around the globe declining, we see some selling back in the good old USA.
That said, I’m worried that normal investors (read: You) will start to fret over whether or not it makes sense to “sell and raise cash”. As I’ve written about oodles and oodles of times before, it’s not a good investment strategy to guess when markets will and will not go up or down. Unless something has changed in your life that requires some short-term liquidity, don’t do anything. Dips, corrections and declines happen all the time. Since you never know when they will begin or end, it’s best to stick with your investment strategy. Whipsawing in and out of cash rarely ever works out as well as just leaving everything alone.
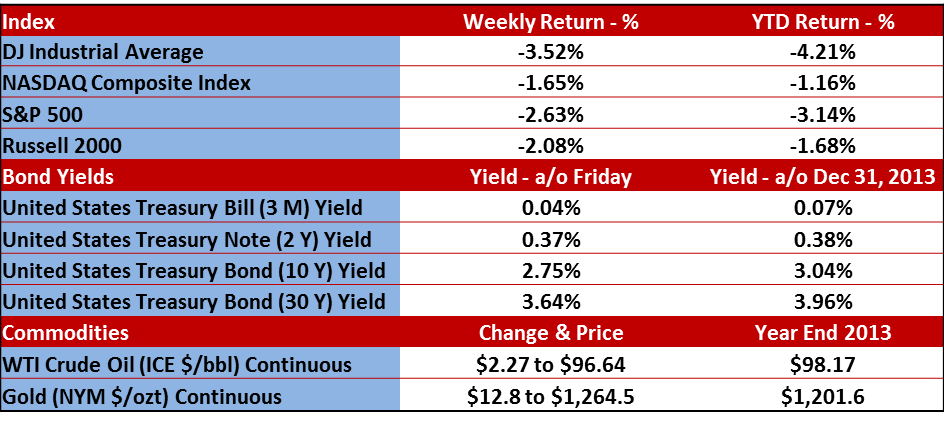
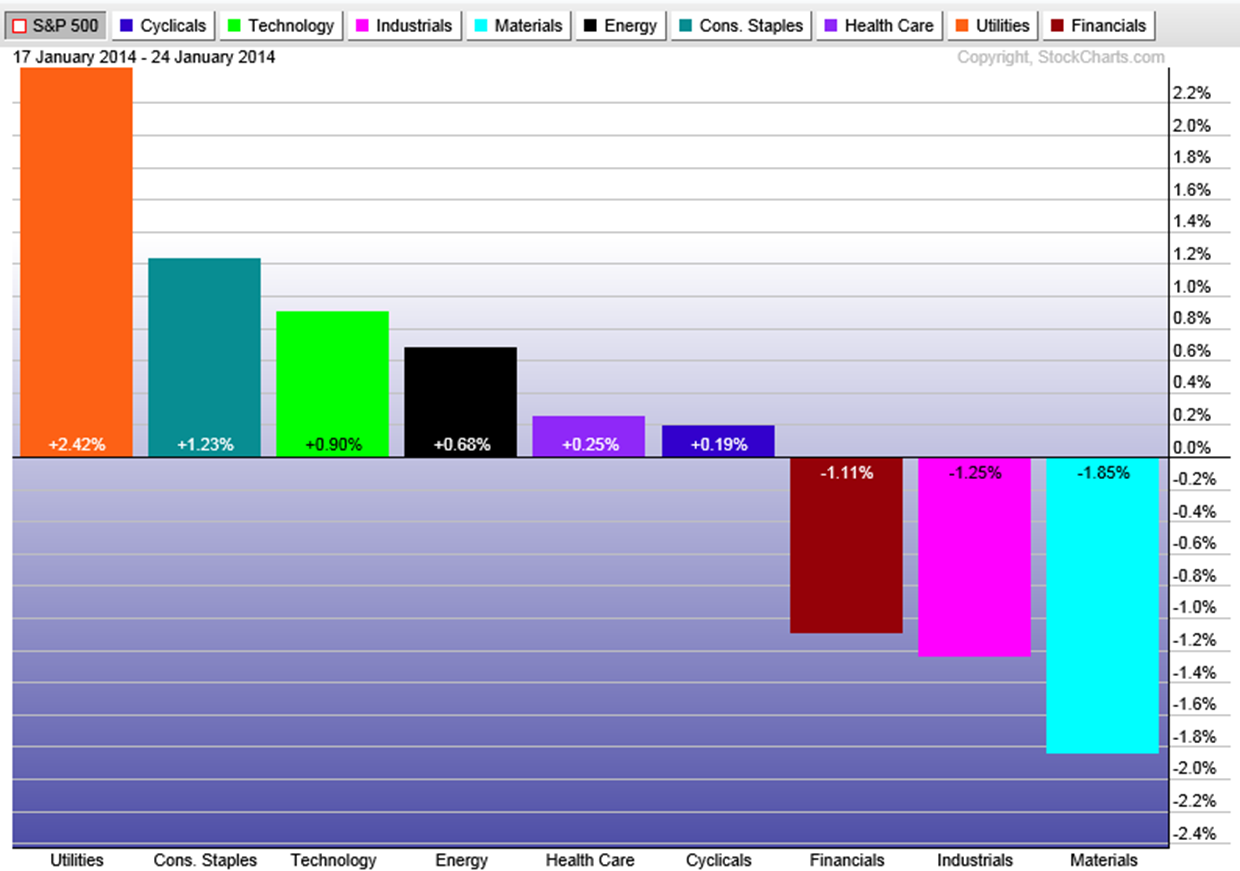
Below are our two standard charts that review the previous week’s performance across the major benchmarks and for the ten sectors of the S&P 500 index.
The chart below shows how well each sector did vs. the S&P 500 (rather than its actual total return).
Corrections
A quick reminder on the word “correction”: A correction is generally defined as a 10% drop from a previous high in the market. Does anyone remember the last time the market had a -10% drop? It was August of 2011. You remember that time in recent history, right? We were reading about a double dip recession for about the gazillionth time, the U.S. debt was being downgraded, and I think I remember something about a giant hole in the sea opening up and sucking the earth back in on itself… or something else equally as scary on being reported on CNBC.
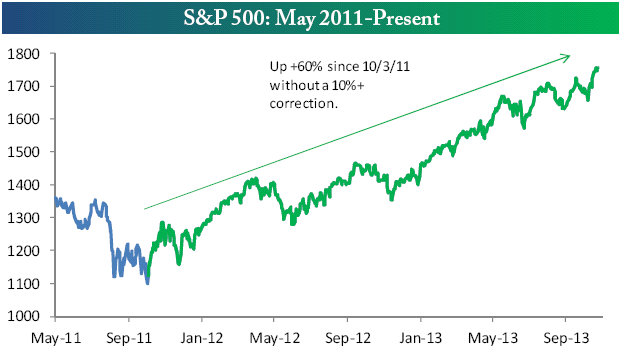
Go back to our October post where we had this chart inserted that highlighted the run in the market without a 10% correction.
We are 3% off the previous high on the S&P 500. So when you start hearing people bellowing on and on about the 3% move, remember these people are probably leveraged to the hilt on their institutional portfolio and really feeling the pain that most normal investors are not feeling. In fact, if it was December 31st and the market was off 3% from the high, you’d be finishing up the year with a 27% return instead of a 30% return.
You are also going to hear a lot of people talking about the S&P 500 crossing below its 50-day moving average. It happens. It’s not the end of the world. See the chart below.
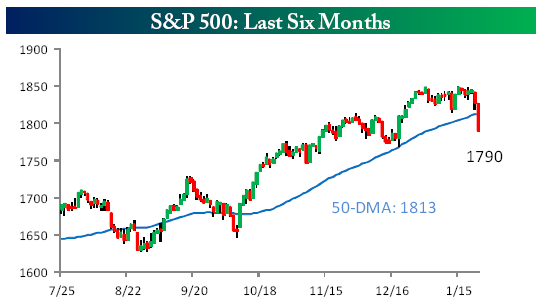
Finally, keep everything in perspective. Just because the calendar flipped does not mean you should.
Earnings Season
Here’s a reminder of where we are in the earnings reporting season. As you can see below in a chart from Bespoke Investment Group, this is a big week for reports. We should have plenty of data by next Monday.
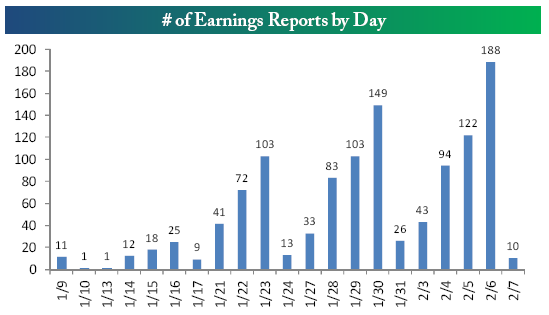
Last week we heard from another batch of companies. By the time it’s all over, we will have seen more than 2,000 companies report quarterly earnings.
The percentage of companies beating their revenue estimate for the fourth quarter of 2013 currently sits at 60.3%. This number is right around the average of 60% we’ve seen since 2001 and well above the 53.2% that finished up the third quarter of 2013. Of course, the earnings reports are not all through yet, but that sure would be a big move from 60.3% down to the third quarter final tally of 53.2%
The percentage of companies beating their earnings estimates stands at 64%, which is higher than the 58.6% final reading from the third quarter. With the exception of setbacks in the first and third quarters of 2013, we have seen a nice steady quarter-over-quarter increase in earnings since the second quarter of 2012. If all holds up this week, the fourth quarter should finish up nicely relative to the third quarter of 2013.
That doesn’t suck.
Bespoke Investment Group follows corporate earnings very closely. They publish a chart that shows the spread between companies guiding future earnings higher or lower on a percentage basis. Up to this quarter, the spread has been negative for the NINE previous quarters, meaning that there are more companies stating they will earn less in the upcoming quarter than the same quarter a year prior.
As of Friday, companies posting negative guidance vs. companies posting positive guidance stands at -1.65%. That means, depending on this week, it is possible we could see companies report that they will earn LESS next quarter than they did in the fourth quarter ten straight times in a row.
TEN.
The last time this number was positive was the second quarter of 2011.
…and how well has the market done since the summer of 2011?
Please call or email with questions.
Investment advice offered through Monument Advisory Group, LLC a Registered Investment Advisor (RIA).
The opinions voiced in this material are for general information only and are not intended to provide specific advice or recommendations for any individual. To determine which investment(s) may be appropriate for you, consult your financial advisor prior to investing. All performance referenced is historical and is no guarantee of future results. All indices are unmanaged and cannot be invested into directly. Stock investing involves risk including loss of principal. The Dow Jones Industrial Average is comprised of 30 stocks that are major factors in their industries, and widely held by individuals and institutional investors. The Standard & Poor’s 500 Stock Index (S&P 500) is an unmanaged capitalization weighted index of 500 stocks designed to measure performance of the broad domestic economy through changes in the aggregate market value of 500 stocks representing all major industries. The NASDAQ Composite Index measures all domestic and non-U.S. based common stocks listed on The NASDAQ Stock Market. The market value, the last sale price multiplied by total shares outstanding, is calculated throughout the trading day, and is related to the total value of the Index. The Russell 2000 Small Stock Index is an unmanaged index generally representative of the 2000 smallest companies in the Russell 3000 Index. The Russell 2000 is an unmanaged index generally comprised of companies with lower price-to-book ratios and lower forecasted growth values. The 2, 10 and 30 year Treasury is simply the yield at the close of the day.
(1) West Texas Intermediate crude spot price is as of end of week.
(2) London Bullion Market Association; gold fixing pricing at 3 p.m. London time.

David B. Armstrong, CFA
President & Co-Founder
Dave got into the industry when he discovered his passion for finance in his mid-20’s. He’s a combat veteran and served as an officer in the United States Marines Corps on both active duty and in the reserves, retiring at the rank of Lieutenant Colonel. While serving on active duty, Dave was unable to spend money on deployments, so he became a self-taught investor. Along with a few bucks cash as a bouncer, his investing performance grew to be good....
IMPORTANT DISCLOSURE INFORMATION
Please remember that past performance is no guarantee of future results. Different types of investments involve varying degrees of risk, and there can be no assurance that the future performance of any specific investment, investment strategy, or product (including the investments and/or investment strategies recommended or undertaken by Monument Capital Management, LLC [“Monument”]), or any non-investment related content, made reference to directly or indirectly in this blog will be profitable, equal any corresponding indicated historical performance level(s), be suitable for your portfolio or individual situation, or prove successful. Due to various factors, including changing market conditions and/or applicable laws, the content may no longer be reflective of current opinions or positions. Moreover, you should not assume that any discussion or information contained in this blog serves as the receipt of, or as a substitute for, personalized investment advice from Monument. To the extent that a reader has any questions regarding the applicability of any specific issue discussed above to his/her individual situation, he/she is encouraged to consult with the professional advisor of his/her choosing. No amount of prior experience or success should be construed that a certain level of results or satisfaction will be achieved if Monument is engaged, or continues to be engaged, to provide investment advisory services. Monument is neither a law firm nor a certified public accounting firm and no portion of the blog content should be construed as legal or accounting advice.
A copy of the Monument’s current written disclosure Brochure discussing our advisory services and fees is available for review upon request or at www.monumentwealthmanagement.com/disclosures. Please Note: Monument does not make any representations or warranties as to the accuracy, timeliness, suitability, completeness, or relevance of any information prepared by any unaffiliated third party, whether linked to Monument’s website or blog or incorporated herein, and takes no responsibility for any such content. All such information is provided solely for convenience purposes only and all users thereof should be guided accordingly.
Historical performance results for investment indices, benchmarks, and/or categories have been provided for general informational/comparison purposes only, and generally do not reflect the deduction of transaction and/or custodial charges, the deduction of an investment management fee, nor the impact of taxes, the incurrence of which would have the effect of decreasing historical performance results. It should not be assumed that your Monument account holdings correspond directly to any comparative indices or categories. Please Also Note: (1) performance results do not reflect the impact of taxes; (2) comparative benchmarks/indices may be more or less volatile than your Monument accounts; and, (3) a description of each comparative benchmark/index is available upon request.
Please Remember: If you are a Monument client, please contact Monument, in writing, if there are any changes in your personal/financial situation or investment objectives for the purpose of reviewing/evaluating/revising our previous recommendations and/or services, or if you would like to impose, add, or to modify any reasonable restrictions to our investment advisory services. Unless, and until, you notify us, in writing, to the contrary, we shall continue to provide services as we do currently. Please Also Remember to advise us if you have not been receiving account statements (at least quarterly) from the account custodian.